Fundamental of PNB Stock
Fundamental |
Quarterly |
Yearly |
| Capital– 42942 cr. Segment – Mid cap Sectoral rank -13 EPS – 2.70 Dividend – 1.64 % |
Total income: 21527 cr Income growth: 0.83% PAT: 281.73 cr PAT growth: -16.72% Net profit margin: 1.31% Basic earning per share: 0.26 |
Total income: 88339 cr Income growth: -7% PAT: 3860 cr PAT growth: 70.78% Net profit margin: 5.06% Net Interest Margin: 2.19% |
| SHARE | FII– 0.99% – | %change: -0.37% | QOQ |
| HOLDING | DII– 11.45% | %change: -0.14% | QOQ |
Peers Comparison
PNB can be compared with Canara BOB & IDBI
| Capital in cr | EPS | PE Ratio | Total Income Quarterly/ Annual in cr | Income growth in % | Profit after tax | Profit after tax growth % | Net Profit margin | Net NPA | FII holdings in % | |
| PNB | 42942 | 2.7 | 14.44 | 21527/88339 | 0.83/-7 | 282/3861 | -16.7/71 | 5.06 | 00 | 0.99 |
| BOB | 71390 | 16,78 | 8.23 | 21576/87780 | -3.98/-1.37 | 1339/7849 | -6.47/429 | 10.69% | 00 | 8.23 |
| Canara Bank | 44183 | 37.65 | 6.47 | 23739/94256 | -3.18/0.64 | 2180/6125 | 13.6/114.5 | 9.18/8.67 | 2.48 | 7.97 |
| IDBI | 46988 | 2.54 | 17.24 | 5835/23238 | 5.47/-6.31 | 768/2533 | 4.62/73.8 | 13.17/13.83 | 00 | 0.02 |
Fundamental analysis Conclusion
PNB can be compared with BOB Canara and IDBI in the PSU segment.
Based on the PE, EPS, profit growth, and Foreign institutional holding, Bank of Baroda looking good in that segment.
Technical Analysis
52 Week High- 48
52 Week Low – 28
Monthly
 Resistance – 40 / 41.90 / 43.4 / 45.90
Relative strength – Near to overbought
To get into a bull run – it has to stay above 48
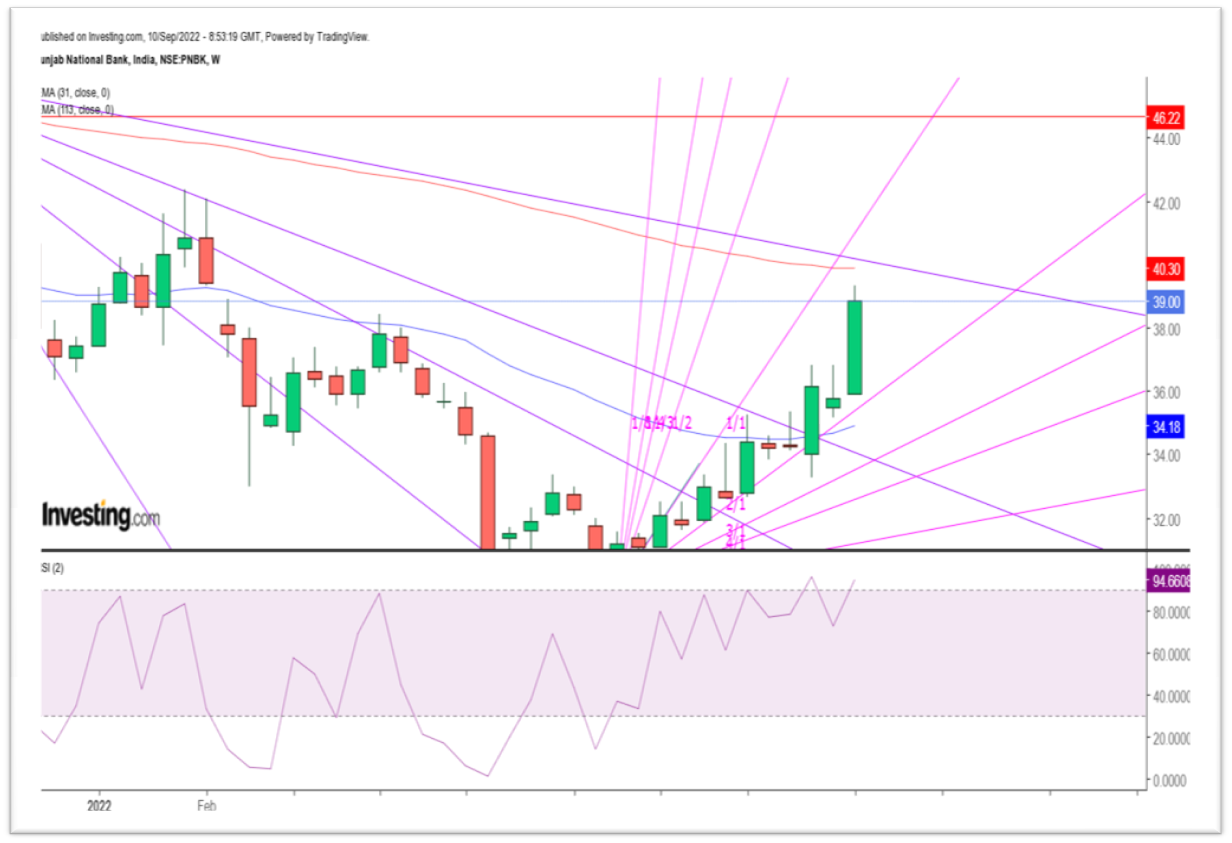
Weekly

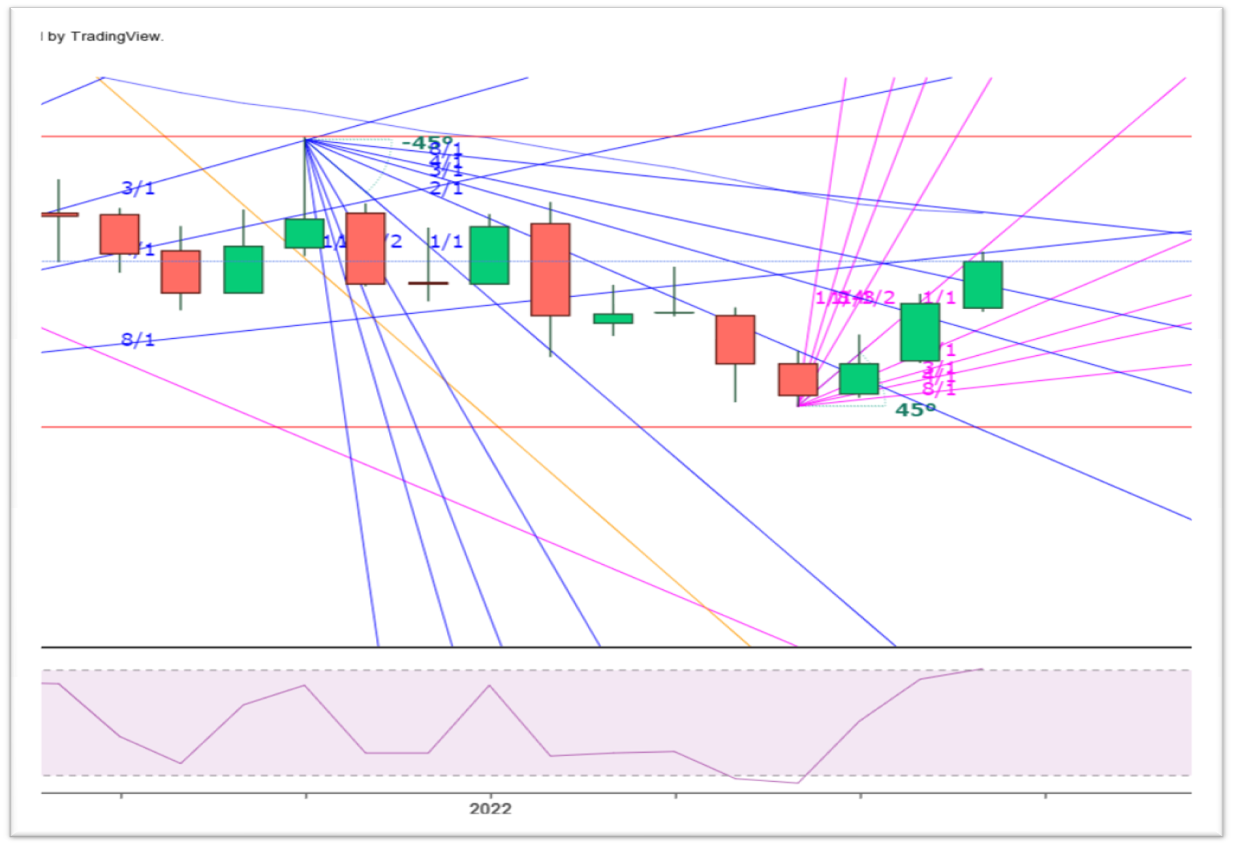
Price on its 45 degree creates a strong support or resistance.
On weekly candle – price to be positive it need to stay above 52
Today, on dated, 13th September – price, 40.70, got resisted on its 113 EMA- exponential moving average, which is 0.784% of the Fibonacci no 144, and closed below 22.5 degree on its price angle.
If the weekly candle close below 39.50 – price going to come down to 36.80 or 35.6– which is the next support point on its price angle 22.5 degree or 15 degree respectively.
Closing above 40.60, and staying there 2/3 trading session will bring the price up to 46.15 or 48.30.
Daily

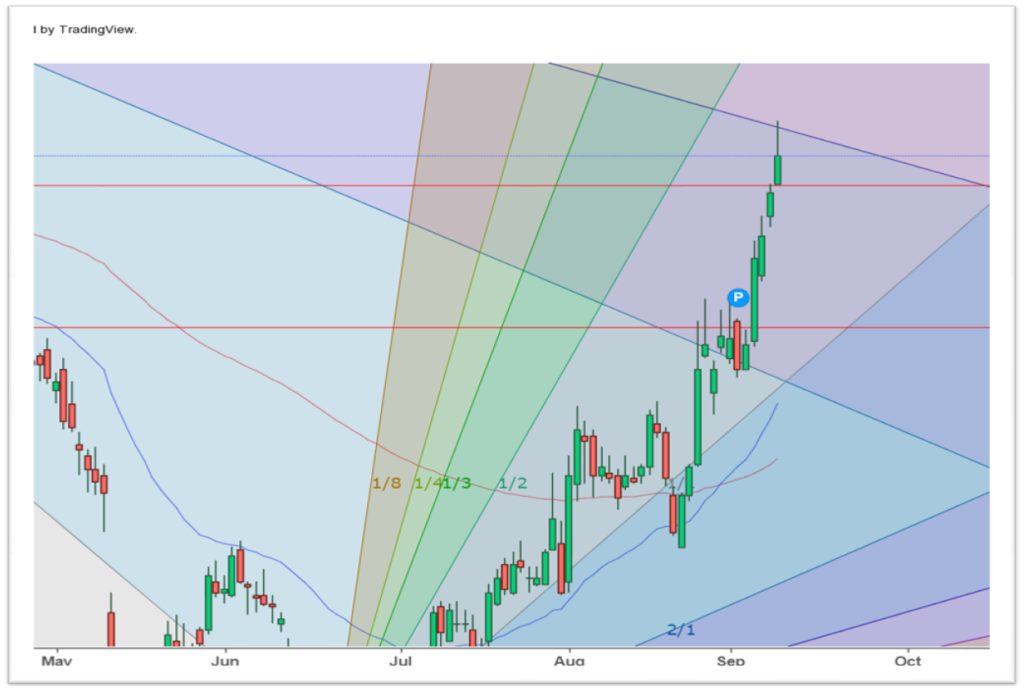
Technically daily looks outstanding.
31 EMA decisively cross over 113 EMA from below making the stock lucrative, and determining price should not fall below 35 in the near term-
Whenever price cross above 45 degree from below, and stay above it – determine stocks entered into a bullish zone-
And should accumulate near 35 keeping 31.5 as stop loss- which is 50% of 45 degree that is 22.5 degree for 43, 45 or 48, which are previous highs.
Breaking below might take the stock to its previous low of 27. Looks impossible for time being.
PNB Time Cycle and Square of 9 No.
CYCLE
- No clear cycle visible on the stock
- We calculate cycles are 100, 90, 60, 50, 45, 30, 25, 20, 10, 5, 3, 1-On price as well as on time
A Square of 9 supports the resistance number
Support
- At 37 – 45 degree
- At 34 – 0/360 degree or
- At 31 – 315 degree-
Resistance
- At 40- 90 degree
- At 43- 115 degree
- At 46- 180 degree
Break Out Calculation
We calculate break out on 114.6 % or 121.6% of previous high and low – It eradicate false breakout.
Here we find no new numbers. That is beyond its degree on weekly or monthly chart.
CONCLUSION
Astronomically all PSU bank entered in to bull zone on 14th of July2022. And the entire market is positive till December 2022, other than the intermediary correction from 23rd oct to 22nd Nov. 2022.
Fundamentally PNB seems to be the weaker withing its Peer. Because of the Astronomical reasoning since 14th July, technically on daily chart its looking good.
If the company is not good enough fundamentally, on bear cycle it fall more than its peers or MSCI index.
We prefer buying the stock above 48.50.
Any position hold should be liquidated on or before 22nd October 2022.
A massive correction is on its way – People should hold the investment in PNB keeping a stop loss of 36.


